Daily Desmos - 24 April - Exploration
Daily Desmos posted two different examples of warping graphs on April 24. As an experiment I combined both graphs into one to see what they would look like.
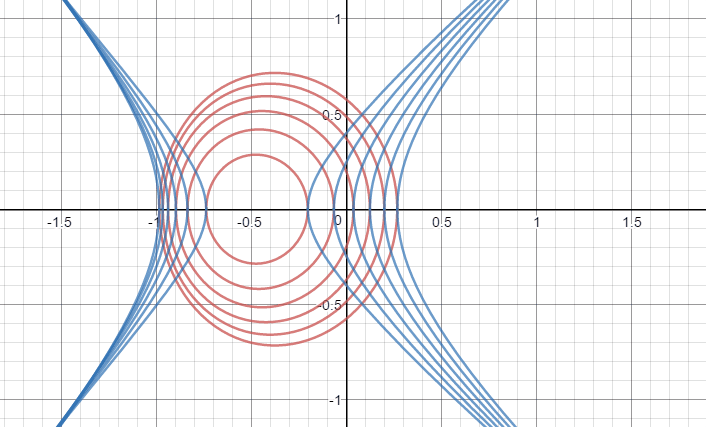
You can check out my version here.
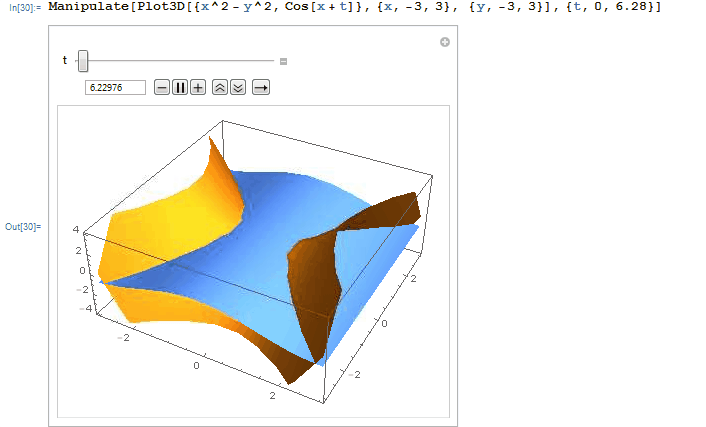
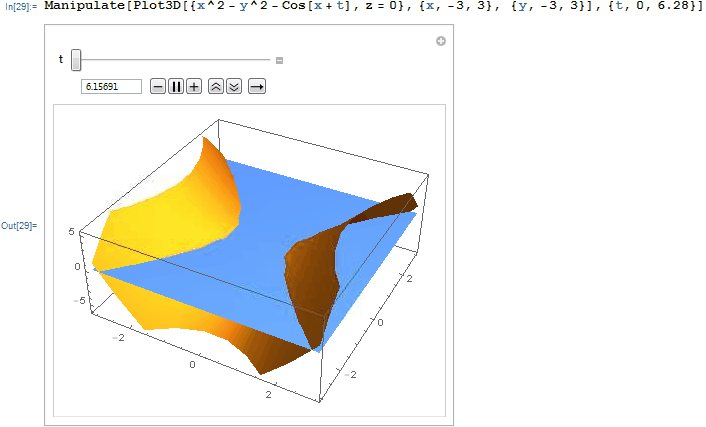
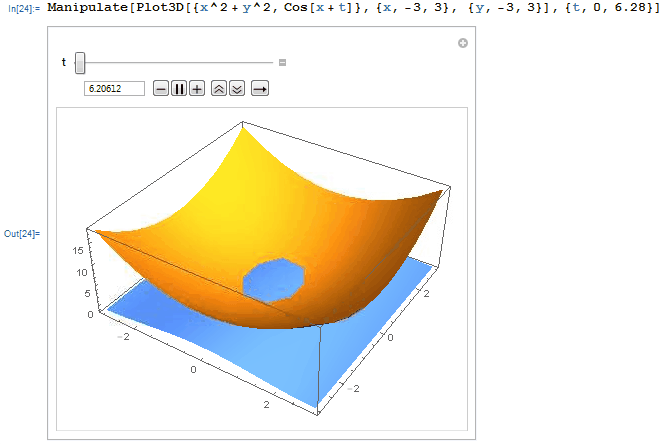
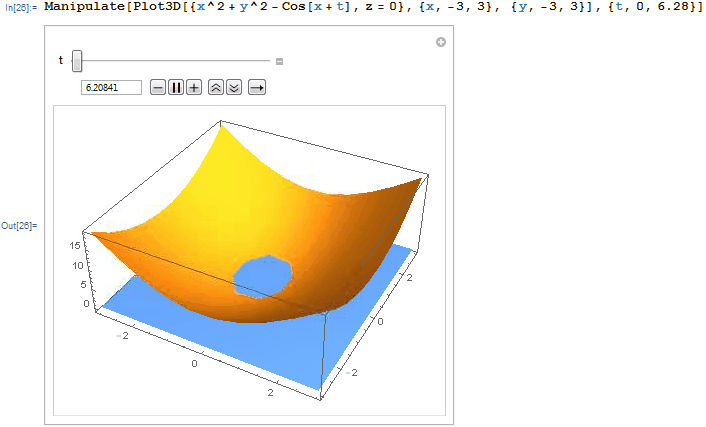
After watching the rings move around for awhile I got to wondering what this image would look like in 3d. I knew that the current graph could be thought of as a 2d slice of a larger 3d image. It took awhile to remember the Mathematica codes to generate 3d animated plots. However I feel that the end results are decent.
The first two graphs show the interaction of x^2+y^2 and cos(x+t). These images relate to the warping circles.
The second two graphs show the interaction of x^2-y^2 and cos(x+t). These images relate to the warping hyperbola.